Audience Engagement Metrics Tool

Chief Executive Officer
Boost Your Events with an Audience Engagement Metrics Tool
Organizing an event is no small feat. You’ve got a million details to juggle, from logistics to content, but how do you know if your attendees are truly connecting with it all? That’s where a tool to measure audience interaction comes in handy. It’s not just about headcounts—it’s about understanding the level of participation, excitement, and buzz your event generates.
Why Engagement Matters
Engagement is the heartbeat of any successful gathering. When attendees ask questions, vote in polls, or share on social media, they’re showing they care. A platform that analyzes these interactions can reveal what worked and what didn’t. Maybe your Q&A session sparked a ton of curiosity, or perhaps your hashtag didn’t catch on. With clear data, you can double down on the good stuff and tweak the rest for next time.
Actionable Insights for Organizers
Imagine having a report that breaks down participation rates and gives you a single score to gauge overall success. Better yet, picture getting tailored advice to ramp up interaction at future events. That’s the power of tracking attendee involvement. Whether you’re hosting a conference, webinar, or festival, these insights help you create experiences that stick with your audience long after the event ends.
FAQs
What kind of data do I need to use this tool?
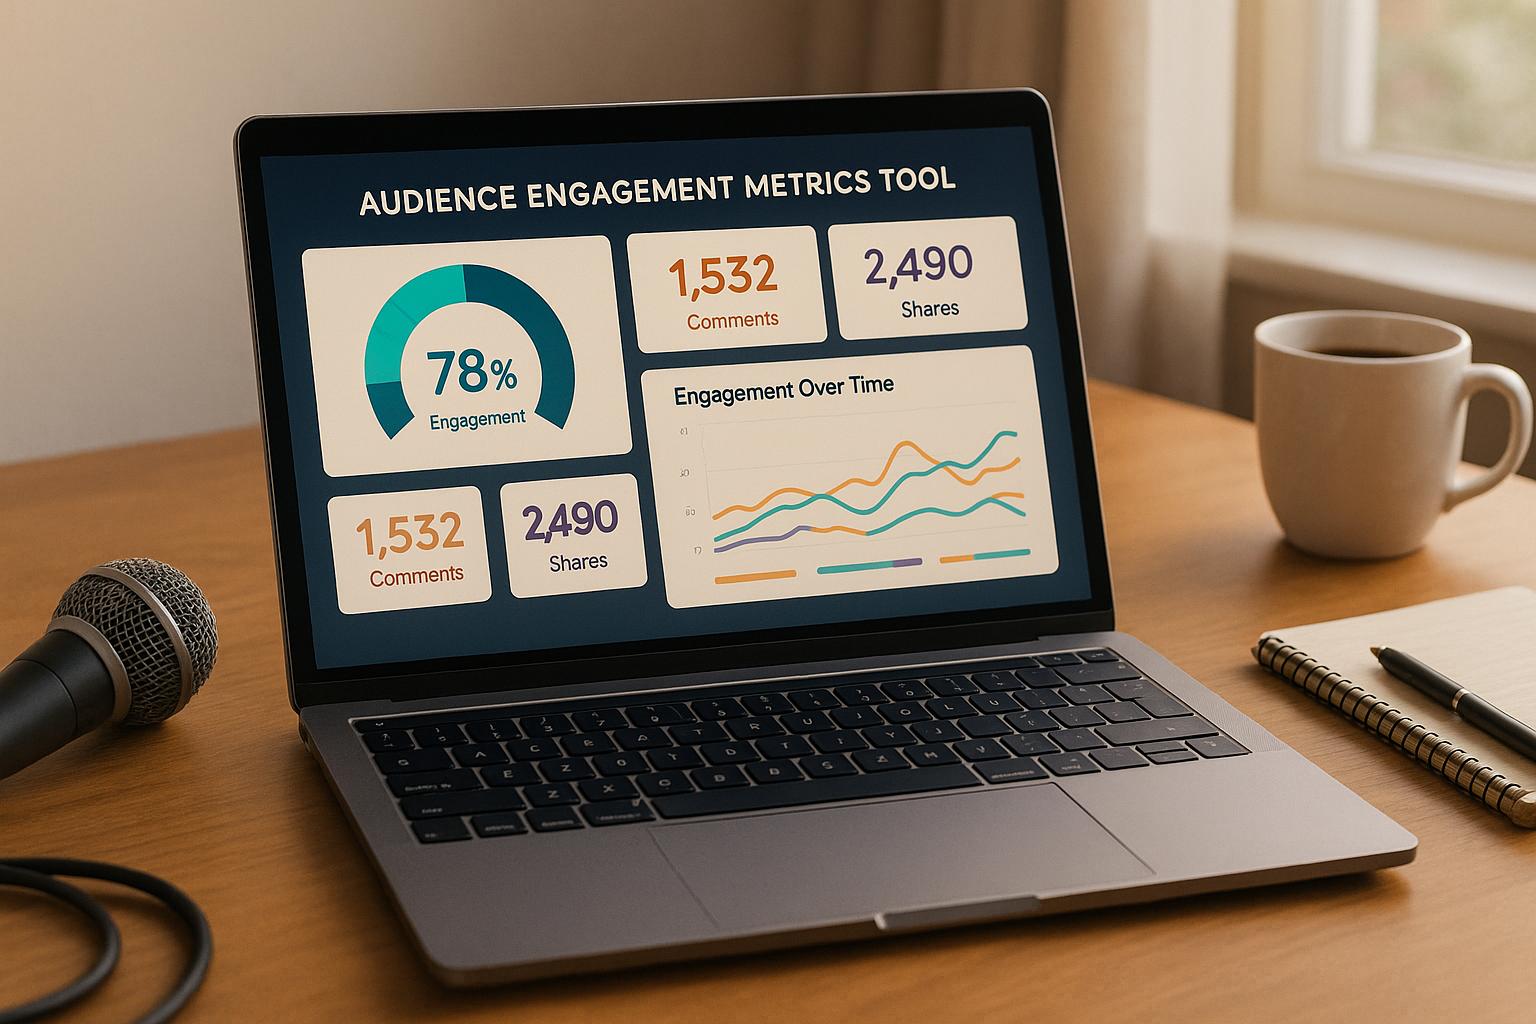
You’ll need a few basic numbers from your event: total attendees, how many questions were asked during Q&A sessions, social media mentions or hashtag usage, poll or survey participation, and any app or platform interaction data like clicks or views. Don’t worry if you’re missing a couple of these—our tool can still work with partial data and give you a solid overview of engagement.
How is the engagement score calculated?
We take all the data you provide and run it through straightforward formulas. For example, participation rate is the percentage of attendees who asked questions or voted in polls. Social media reach is mentions divided by total attendees. Then, we assign weights to each metric based on its impact and average them into a single score from 1 to 10. It’s all transparent, so you can see exactly how we got there!
Can this tool help me improve future events?
Absolutely! Beyond just giving you numbers, the tool offers a short interpretation of your results—like whether your Q&A was a hit or if social media buzz was low. Plus, you’ll get practical tips tailored to your data, such as encouraging live polls or promoting a unique hashtag next time. It’s like having a consultant in your pocket.


Streamline your workflow, achieve more

Lorem ipsum dolor sit amet, consectetur adipiscing elit. Maecenas ac velit pellentesque, feugiat justo sed, aliquet felis.

Lorem ipsum dolor sit amet, consectetur adipiscing elit. Maecenas ac velit pellentesque, feugiat justo sed, aliquet felis.